


Using the Repository housed at the Manitoba Centre for Health Policy: learning from the past, planning for the future
Patricia J. Martens. PhD
Contributors to the ideas in this paper: Drs. Dan Chateau, Lisa Lix, Marni Brownell, Les Roos and all the researchers who have done MCHP deliverable projects.
1. What is MCHP? And how do we inform policy questions?
The Manitoba Centre for Health Policy (MCHP) is a unit of the Department of Community Health Sciences, in University of Manitoba’s Faculty of Medicine. MCHP came into existence in 1991 through a contractual relationship with the provincial government’s Department of Health (known as “Manitoba Health”), but the two key founders (Drs. Noralou and Les Roos) had been using administrative claims databases to do grant-funded research since the mid-1970s. The mission statement of MCHP is: to provide accurate and timely information to health care decision-makers, analysts and providers, so they in turn can offer services which are effective and efficient in improving the health of Manitobans.
Presently, about half of our research dollars come from external peer-reviewed granting agencies (such as the Canadian Institutes of Health Research). The other half comes from the MCHP/Manitoba Health five-year renewable contract to do “deliverables” and to maintain the databases that we refer to as the Population Health Research Data Repository (or “Repository”). It is important to understand the nature of these “deliverables”, since it is the crux of how we maintain our academic credibility yet also maintain our financial stability. The Director of MCHP (Dr. Patricia Martens) negotiates annually with Manitoba Health to complete six research studies that are highly policy-relevant, while still being highly relevant to the health policy researchers themselves in terms of interesting methodology, current topic area or new concept. Through a negotiation period lasting around 4-6 months, the Director and the Deputy Minister of Health decide upon the 6 topics for the next fiscal year. Each of these deliverables takes approximately 18 months to complete, with each project requiring ethical approvals prior to any analyses. These are independent research projects that will be done to the best of the ability of the health researchers assigned to it, without government involvement beyond a “working group” role. All deliverables are made publicly available at release, and researchers publish peer-reviewed journal articles arising from these deliverables. At the “final draft” stage, the report is sent to Manitoba Health and other stakeholders, as well as to peer reviewers for feedback and final revisions. There are also briefings to the stakeholders. Approximately two months after the final draft, once all revisions have been made, the four-page summary written, and the report printed, the report is publicly released. There are no “confidential” reports, i.e., Manitoba Health cannot request that MCHP withhold information that may be deemed sensitive to the government. MCHP, on the other hand, does the best job possible to ensure that the data are correct, the analyses are valid, and the interpretations are credible to researchers and decision-makers alike.
Since its inception, MCHP has been at the forefront of knowledge translation (KT), ensuring that research knowledge is “translated” into action at the policy, program or planning levels. Its innovative approaches have included the writing and wide distribution of four-page user-friendly lay language summary documents for each report since the mid-1990s, and the use of the web page (www.umanitoba.ca/centres/mchp/) for dissemination of reports and for educational materials. The website alone receives over 100,000 “hits” per months from around the world. One critical aspect of “researcher-to-researcher” KT is the web-based Concept Dictionary and Glossary where concepts using administrative claims data are documented, including information on the statistical code used, the definitions, ways in which the concept has been used, and different research projects where examples can be seen. For example, if one were to look up “continuity of care” as a concept, the Glossary will report how this has been defined in our physician claims database.
To ensure that the message “gets out” into policy arenas, MCHP also uses briefings to top-level government decision-makers (Minister, Deputy Minister and Assistant Deputy Ministers of Health, plus other stakeholders as required), workshop forums for researcher/decision-maker interactions, media exposure of reports and the more traditional academic dissemination through conferences and publications. During the year, MCHP hosts three different workshops one for Manitoba Health planners, one for the Winnipeg Regional Health Authority (RHA), and one for the 10 non-Winnipeg RHAs. The latter alone attracted over 200 attendees in fall 2005, where a new report (Sex Differences in Health, Health Care Use and Outcomes of Care by Fransoo, Martens, The Need To Know Team et al., November 2005) was highlighted, followed by round-table facilitated discussions to ponder the “what, so what, now what” scenarios for taking research into action.
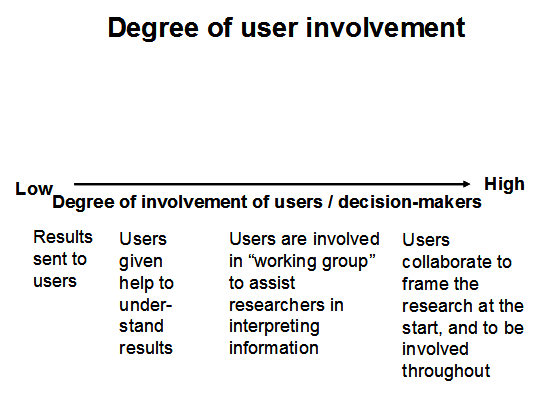
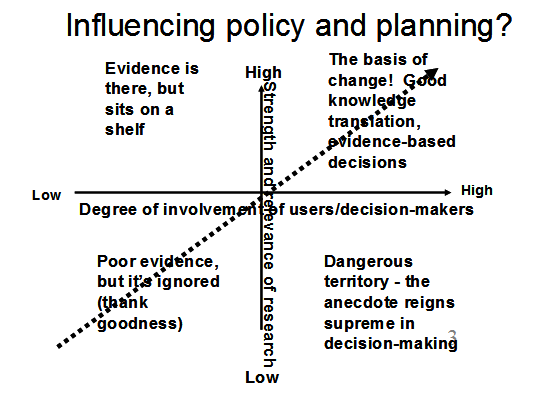
Since 1991, MCHP has gone down the road of user involvement in creative ways. Although the traditional “sending out of the results” is still important, MCHP has also developed annual research forums for policy-makers since 1994 so that users are given help to understand the results. These have become highly interactive events since 1999, with users and researchers engaging in round-table discussion groups to examine research reports from various perspectives. Along the continuum of user involvement, user stakeholder groups (such as the Manitoba Medical Association, or hospital administrators, or experts from the government in special areas such as home care) have also been incorporated into the working groups for deliverables. At the far right of the spectrum, MCHP’s award-winning The Need To Know Team, funded through CIHR (directed by P. Martens), is nationally known as an innovative “made in Manitoba” model of researcher/decision-maker interaction. The Team is comprised of MCHP researchers and graduate students, Manitoba Health planners, and two top-level planners from each of Manitoba’s RHAs. The Team’s purpose is to: (a) co-create new knowledge as a Team of researchers and users of the research, on topics of high relevance to rural & northern planners and policy-makers; (b) to encourage two-way capacity building between the researchers and the decision-makers on the Team; and (c) to develop innovative ways of ensuring that the research is disseminated and applied at the regional and provincial level. As discussed in a recent article in the Healthcare Policy journal (Martens and Roos, Fall 2005) and illustrated by the diagram, a key to influencing policy and planning is to ensure that the research is of the highest quality (valid and relevant) while at the same time there is a high degree of user involvement from start to finish. This enables researchers to ask the “right” questions, analyze the data while understanding context, and make sure that the messages get quick uptake by those who are most instrumental in applying those messages.
To illustrate the power of studies which speak to the decision-makers within healthcare systems, here are some examples of “deliverables” arising from the Manitoba Health/MCHP discussions. As a result of user-researcher connection and consensus on topics to be studied, there is a strong sense of policy-relevance which may or may not necessarily occur when research is decided upon in isolation. There is also a strong sense of research validity when a respected health services research centre has academic freedom to produce the best possible research study using population-based data. Some examples of key findings from MCHP studies done as deliverables for Manitoba Health include:
- (a) if medication use for “high-cost users” was reduced through medication reviews from an average of 12 to 11 different drugs, savings would be over $8 million per year in Manitoba (Kozyrskyj et al. 2005)
ACTION: pilot project of medication reviews at home care onset - (b) Adult flu immunization decreases emergency room visits and hospital use during a peak flu season by 20-40% (Menec et al.1999)
ACTION: flu immunization offered to high risk groups - (c) if preventable childhood injury rates in the lowest SES could be lowered to that of the middle SES, there would be 376 less injury hospitalizations a year in Manitoba (Brownell et al. 2001)
ACTION: injury prevention strategy begun by government in 2002 - (d) Re-hospitalization of newborns within six weeks of hospital discharge is 30% higher if a newborn is not breastfed after controlling for a multitude of other factors; breastfeeding support programs could potentially yield substantial hospital savings (Martens et al. 2004)
ACTION: strategy to increase breastfeeding initiation and duration rates across the province (now part of the target indicators for each RHA), and to encourage implementation of the WHO/UNICEF Baby Friendly Hospital Initiative (BFHI).
Similarly, The Need To Know Team studies (co-funded through the Manitoba Health contract and the CIHR grant) have a strong “track record” of policy-relevance, including a Mental Illness report (Martens et al. 2004) which has resulted in discussions throughout the province and across Canada on the health care needs of those with mental illness. The government of Manitoba also released a comprehensive strategy on mental illness in December 2005, including a call for further training of all health care workers, accessibility of mental health services for suicide prevention throughout the province, and special mental health teams for clients experiencing mental illness and recently discharged from a hospital setting. The most recent report on sex differences in health, the use of health care and quality of care (Fransoo et al. 2005) provided valuable information to regional health authorities on areas needing attention. For example, it was found that females are less likely to receive appropriate beta blocker prescriptions after a heart attack, and males are less likely to receive appropriate followup care after a physician prescribes an anti-depressant medication. However, the report also found that at any given age group, female heart attack patients were just as likely as their male counterparts to receive cardiac care such as cardiac catheterization.
2. What is the Repository (Population Health Research Data Repository) and how are these data stored, anonymized and accessed?
MCHP houses over 65 databases collectively referred to as the Population Health Research Data Repository. These are derived from administrative claims data, that is, data which are obtained in order to administer the universal health care system or another program within Manitoba. The Repository includes information of key interest to health planners, such as mortality and birth information, physician and hospital use, pharmaceutical use, type of physician specialty, and use of services including home care, nursing homes (personal care homes). Recently, databases on family services (social assistance) and on public school educational outcomes have been incorporated into the Repository. Census data at the enumeration area level is used to yield an “average household income” for the geographical area, and this average household income is attributed to all people living in the area. This gives insight into how socioeconomic factors affect health patterns or health care use.
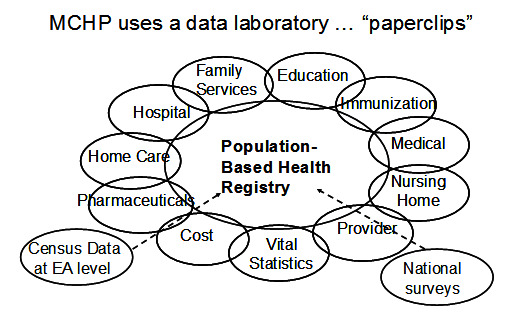
We often refer to the data in our “data laboratory” as ‘paperclip’ data. Paperclips were originally intended to hold together pieces of paper, but they can also be used in many ways beyond their original intent such as necklaces or earrings, key holders, gadgets to unlock doors or reset digital watches or blackberries, or even as surgical instruments to relieve pressure of blood accumulation underneath a fingernail! Similarly, our Repository data were originally intended for purposes of paying bills to physicians or hospitals, or administering programs such as home care. We use the data for research purposes, to explore such issues as the patterns of disease or mortality throughout regions of the province, the use of the health care system, the “pathway” of care of individuals with certain health concerns, and even the long-term outcomes of individuals with certain risk factors.
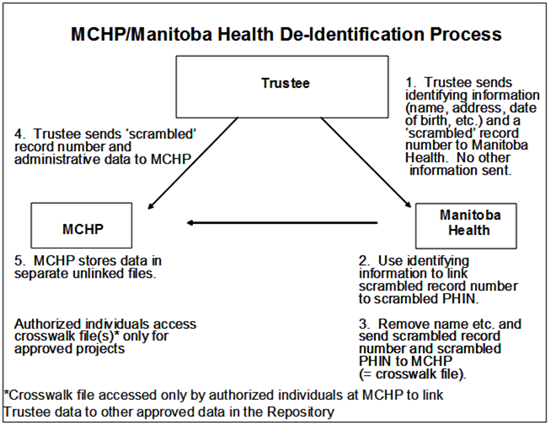
Prior to MCHP receiving any data, identifying information such as name, street address and true health number is removed. Therefore, the Repository contains anonymized information only, which is “linkable” across files through a fictitious encrypted number assigned to the records. All datasets are linkable through what we refer to as “crosswalk files”, which are created in the Health Information Management Unit of Manitoba Health (see diagram for a complete description of the creation of crosswalk files). Data crosswalk files are produced using health numbers where possible, or deterministic/probabilistic linkages on such information as age, sex, area of residence and so on if health numbers are not present. All data are kept in separate files that are “unlinked” until the proper approvals are given for a project. Data are only accessed for approved research projects, not for administrative purposes. Prior to any analyses, all projects require ethical approval from the Faculty of Medicine’s Research Ethics Board and approvals from the Health Information Privacy Committee of the Manitoba Government and from any data stakeholder (such as Family Services). The data laboratory itself complies with the highest standards of privacy and confidentiality, with limited access to files, oaths of confidentiality and firewalls. MCHP has also piloted the provincial Ombudsman’s Privacy Compliance Tool.
The universal health registry, virtually including all residents of Manitoba, allows for true population-based analyses with no limitations such as sampling frameworks, biased samples, or non-response. This underscores the importance of using the Health Registry as the basis, or “core”, of the Repository. Under our universal health care system in Manitoba, virtually all residents of the province have a Manitoba Health Card. Manitoba Health thus has information about every resident’s age, sex, birthdate, area of residence and date of coverage. This enables MCHP to use a population-based denominator in any calculation of rates, knowing what the population of Manitobans is at any given moment in time. MCHP updates its anonymized version of the Health Registry semi-annually. Therefore, we not only see those people who contact the health system or the program, but we also know who lives in Manitoba but does not contact the system (hence, it is a population-based analysis rather than a facility-based analysis).
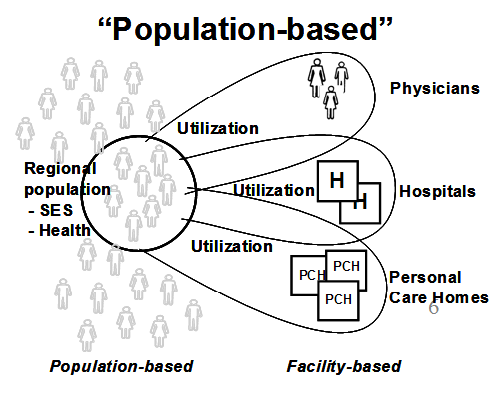
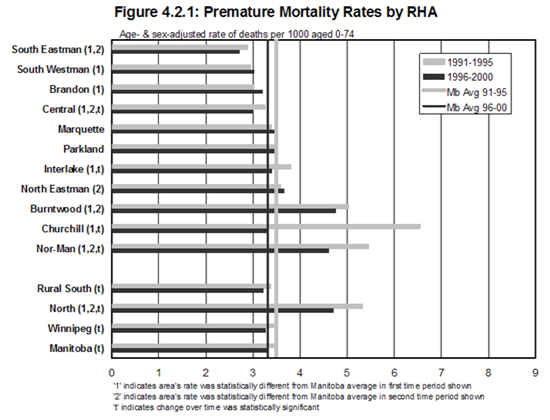
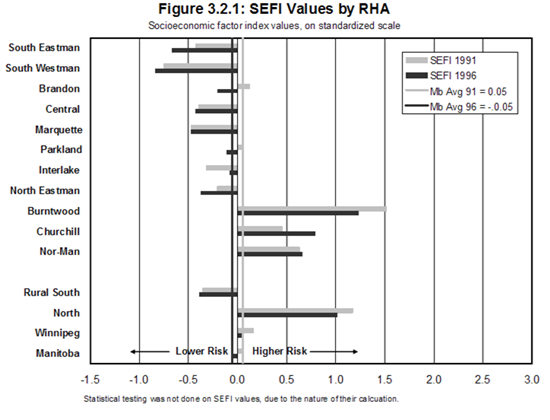
Frameworks for analyses can be geography, specific groups (such as older adults, children), need for health care services (as measured by the “healthiness” of a group of people), or determinants of health (such as income grouping or socio-economic risk). MCHP has developed several concepts for measuring underlying need for health care services. Premature mortality rate, or age/sex-adjusted rate of death before age 75, is considered a robust measure for the overall “healthiness” of a group of people, and presumably their underlying need for health care services (Carstairs & Morris 1001; Eyles et al. 1001; Eyles and Birch 1003; Reid et al. 2002). MCHP reports often report geographical rates of health care services within the framework of underlying regional PMRs to illustrate the relationship between use and “need” (see examples given in the discussion on the following pages). Furthermore, a composite index has also been developed at MCHP which is comprised of various Census measures to determine an overall socioeconomic factor index (SEFI) for residents of geographical areas of the province. The higher the SEFI value, the greater the socioeconomic risk of an area, and presumably the greater the need for health care services. PMR and SEFI have a strong correlation, so PMR can also be considered a “surrogate” measure for underlying socioeconomic risk and need for health care services (see Martens, Frohlich et al. 2002).
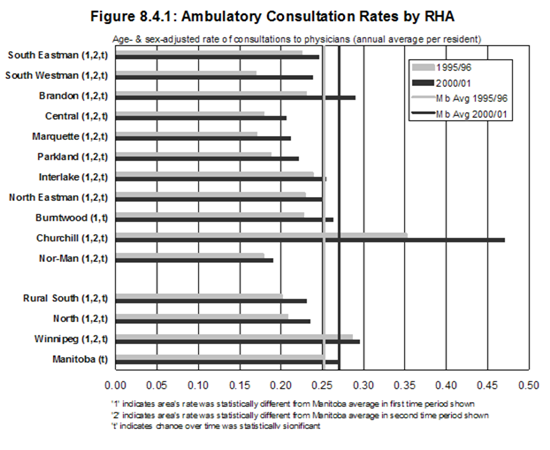
The two graphs below illustrate PMR and SEFI, and are both include in the RHA Indicators Atlas report (Martens et al. 2003). This report looked at two time periods (depending upon the indicator used) early to mid-1990s, and late1990s. On the left hand side are the 10 non-Winnipeg RHAs, with four comparators at the bottom the Manitoba (i.e. provincial) rate, the Winnipeg rate, the aggregate rate for the three northern RHAs (the “North” is a combined rate for Churchill, Burntwood and Nor-Man), and the Rural South rate (all other RHAs excluding the two urban centres of Winnipeg & Brandon and the three northern RHAs). The grey lines are the earlier time, and the black the later time period.
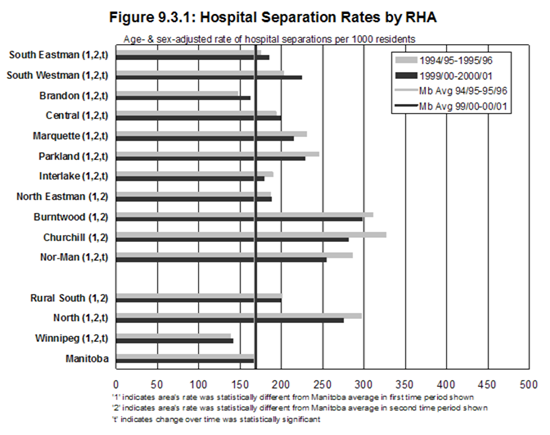
Using PMR (or the highly correlated SEFI) as a framework for the underlying healthiness of the residents of a region, a planner or policy-maker can determine the relationship between this underlying “need” for health services and the actual rates of use of various health services. For example, the figure shown here (9.3.1) from the RHA Indicators Atlas (Martens et al. 2003) demonstrates a relatively strong association between the underlying health status of the population within each region of the province and the hospital separation (discharge) rates. Those regional health authorities with the lowest PMR (those at the top) have a correspondingly lower hospital separation rate. Those at the bottom (Burntwood, Churchill, Nor-Man) have the highest PMR, and not surprisingly, the highest use of hospitals an indicator that the system is most likely corresponding to “underlying need”.
Although hospital separation rates do correspond highly with PMR and SEFI, not all health care services do. Ambulatory consultation rates (ie, rate of first referral to a specialist) do not necessarily correspond with underlying need for health care services. It corresponds more with availability of specialists, who mostly reside in Winnipeg and Brandon. Churchill is an anomaly, being very remote yet having a model of “fly-in specialist” health care. But in general, the rural and northern areas of the province show lower consult rates that have little relationship to the health status of the residents.
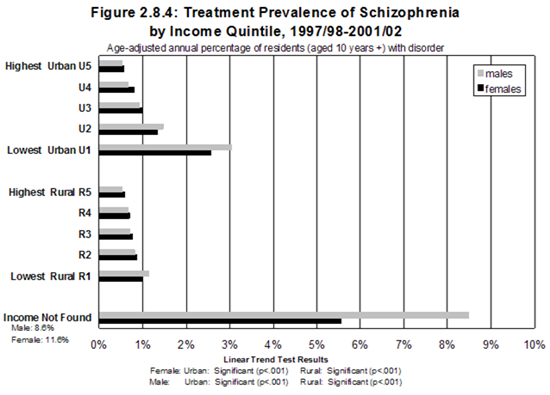
A less complex yet robust measure is often used for analyzing disparity, using only neighbourhood income from Census Enumeration Area level figures with each resident of the EA being “attributed” the average household income for that area. Five groupings, called “quintiles”, have been established for urban and rural residents, with “urban” being defined as those living in the two urban centres of Winnipeg and Brandon, and “rural” being the rest of Manitoba. A graph from the Mental Illness report (Martens et al. 2004) shows a strong relationship between urban neighbourhood income groupings and prevalence of schizophrenia, with almost six times the prevalence in the lowest income grouping compared to the highest. The relationship in rural Manitoba shows much less difference. (note: the income not found group refers to postal codes that are associated with institutionalized individuals, or provincial trustee offices).
3. What are the experiences of MCHP researchers in longitudinal data analysis - using only the Repository, or a hybrid?
Much of what MCHP has labeled “longitudinal” research has been time series analyses. In other words, trends in something like hospitalization rates by year, or mortality rates over time, have given a sense of “longitudinal” analysis. This is different than following a cohort of people over time, in a prospective analysis (or retrospective analysis) of long-term outcomes (or risk factors).
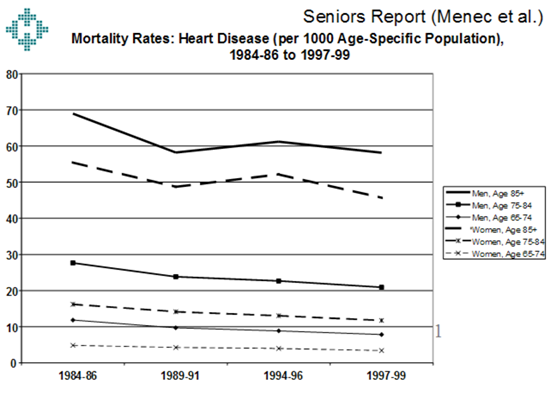
One report (Brownell et al. 2003) looked at the health status of Manitobans over time, to explore the issue of the widening gap between the most and least healthy. From 1985 through to 1998, it was discovered that the “gap” resulted not in worsening health status of the least healthy, but increasing healthiness of the most healthy (while the least healthy stayed the same). Another report on seniors (Menec et al. 2002) looked at trends in seniors dying from heart disease from 1984 through to 1999, concluding that mortality rates for heart disease declined significantly for both men and women for all age groups with the exception of men aged 85+ (25% or more for ages up to 84, 16% for women aged 85+).
Another two deliverables used historical trend data and projected demographic data to predict the need for hospital beds (Stewart et al. 2002) and nursing homes beds (Frohlich, De Coster and Dik 2002) in the year 2020. Two types of models were used for the hospital bed projections the current use projection model based on three years of hospital data to define use of hospital beds by age, sex and region; and the trend analysis which was based on trends in hospital use over a 10 year period to reflect improvements in treatment and technology. The first method suggested that a 25% increase in non-surgical beds was required, whereas the trend analysis projected a requirement for only 83% of the current bed numbers (due, presumably, to trends in shorter hospital stays and projected technological advances).
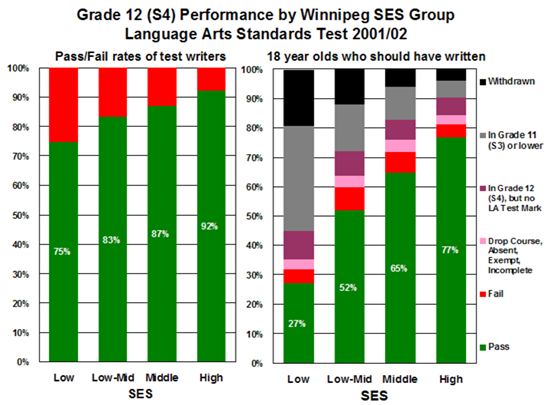
In the realm of true prospective cohort studies based on administrative claims data, recent work has followed cohorts of children and mothers to determine risk factors for poor school outcomes (Brownell et al. 2004). These studies have proved immensely powerful in (a) providing more accurate denominators for cohort outcomes; (b) providing more extensive family background information; and (c) providing valuable information on biological and social factors present at birth to determine risks for long-term outcomes. For example, following a cohort of all children born in 1984, they were able to determine the “true” Grade 12 performance on the language arts standards test in 2001/02. If you were to rely on “in school” data only, you miss the underlying denominator of those children who should be in school but are now “missing” in the school records (even though they are still residents of Manitoba through the Health Registry). The Registry was also able to determine those who moved out-of-province, or who died. As noted in the graphs, adding in the population-based perspective together with the longitudinal perspective, it was determined that there is a much steeper gradient in educational outcomes when the entire birth cohort is used rather than only those listed in the school registries.
Brownell et al. are currently working on another study which is looking at the effect of teen parenthood on long-term outcomes of the children, both in relationship to school and to the use of income assistance programs. These data are not yet public. Jutte et al. is presently working on predictors of all-cause hospitalizations, as well as grade 12 examination results, in a cohort of children, including biomedical predictors (gestational age, birth weight, 5-minute Apgar score) and social predictors (maternal age, socio-economic status, marital status).
In the Mental Illness report (Martens et al. 2004), most analyses were “cross sectional” over the five year period. However, one analysis followed a cohort of people entering nursing homes in 2002/03. It was determined that 75% of those entering the nursing home had experienced at least one diagnosis of a mental illness within the previous 5 year time period.
In the Sex Differences report (Fransoo et al. 2005), a cohort of males and females experiencing an acute myocardial infarction (AMI) were followed forward in time to determine what proportion also received interventions. The age-specific procedure rates were not statistically different for males and females. At every age, a female AMI patient was as likely as her male counterpart to get catheterization, angioplasty, coronary stent insertion, or bypass surgery.
At this point in time, linkages to Statistics Canada survey data have mainly been used for cross-sectional analyses, or validation studies to determine the validity of various administratively-based disease algorithms. One study was done in conjunction with the Mental Illness report (Martens et al. 2004) but went into greater detail about the “cohort” of people in the 1996 NPHS who had scores indicating 90% probability of depression within the past 12 months (Cleary 2005). Compared to non-depressed people (4.8, 24.8; visits per person for one and five years), there was a higher visit rate to all physicians for those who had depression in the administrative dataset (10.4, 37.4; visits per person for one and five years) and the survey data (6.8, 33.6; visits per person for one and five years). Those people who were categorized as depressed in both data sets had the highest all physician visit rate, almost three times the rate of those without depression (13.2, 57.7 visits per person for one and five years). Those people who met both definitions of depression had more than 1.5 times the rate of hospitalizations (1.87 per person over five years) than those not depressed (1.04 per person over five years).
4. Points to ponder: Pros, cons and questions about administrative claims data & survey data
The following is a bullet-point description of the pros and cons (advantages and limitations) of administrative claims data for longitudinal research, followed by the pros and cons of linking administrative databases to cross-sectional surveys.
4.1. Administrative claims data:
Advantages:
- - contains entire population of Manitoba (ie, no exclusion bias)
- - able to look at subset of the population, such as population by region (six-digit postal code assignment, Municipality assignment), by socioeconomic status (surrogate income level, determined through Enumeration Area level average household income), by various demographic descriptors (age, sex), and occasionally by ethnicity. Registered First Nations as defined by registration under the Indian Act is the only descriptor of this nature for the entire population. Although this has been done for one MCHP report (Martens et al. 2002), this is still under negotiation for future linkage.
- - “reliable”data in the sense that uncomfortable “questions” are reliably captured due to contacts with the health care system and corresponding diagnoses: such as the use of mental health services, prescriptions for drugs, diagnoses for substance abuse, diagnoses for certain diseases. For example, in our mental illness report (Martens et al. 2004), it was found that a cross-validation between NPHS and the administrative claims data showed a huge underreporting of contacts with the health care system for reasons of mental illness of up to 50%.
- - Population-based approaches to evaluating interventions or doing “cohort study” followup. Although the “experimental design” may not be an RCT, its quasi-experimental potential (such as comparison group time trend analyses, or case control studies, or prospective) has extremely high external validity, ie, “real world” generalizeability. As well, “what works” can be asked in a multitude of ways, by area or sex or age group or SES group to see differential effects of interventions at the population level.
- - People are “survey fatigued”, with all the corresponding potential survey biases. Administrative claims data are non-invasive, complete and can in some ways handle privacy concerns even better than surveys (encrypted identifiers, no need to contact people to gain consent and thus jeopardize the encryption of the anonymized dataset).
- - For the most part, the administrative databases have a relatively high degree of validity and reliability, due to the fact that bills are paid and programs are run based upon these data.
Limitations:
- - Although the data are vast, there are also missing elements in the data (such as self-rated health, BMI, smoking status, breastfeeding duration or other such elements which are not at present collected in the Manitoba Repository)
- - There may be gaps in the data (for example: emergency room data, some datasets where only aggregate numbers are given such as the present diagnostic imaging data, in-hospital drug data), but on the flip side, there is always “scope for the imagination” as new data sources are determined and stakeholder agreements are signed.
- - Salaried physician data, and other primary care provider data (nurse practitioners) is collected in Manitoba through “shadow billing”, but it has been shown that data are incomplete. This is a persistent concern that may become even greater as we go to more primary care models. Directors of database centres like MCHP must be eternally vigilant at convincing provincial governments of the critical nature of person-based data (ie, data that has a personal health number that can be encrypted and linked cross-data set) and data reflecting contacts with the entire health care system (for example, mental health program data on use of psychologists).
- - Databases are often complex, and accurate information must be collected on the meaning of fields, changes in fields over time, and possible changes in the method of coding. For example, we are currently experiencing the ICD-9-CM to ICD-10-CA coding transition for hospital records, and this is a real challenge to ensuring the validity of longitudinal studies pre- and post-implementation.
- - Timeliness of data may be an issue. For example, it often takes more than a year to obtain health data, and over two years to obtain “cause of death” data. Therefore, by the time studies are publicly released, it is not uncommon for the data to be two to three years “old”.
- - Data are only as “good” as the records upon which they are based. There may be variation in coding practices between physicians, hospitals, schools or whoever inputs the data
- - There is a critical need to document the “corporate learning” of a research centre such as MCHP, and this takes time and resources. MCHP (Les Roos) has instituted the Concept Dictionary and Glossary on our website, to encourage researcher-to-researcher knowledge translation for the benefit of those using administrative claims data for research. Concepts include definitions, SAS coding, limitations, validation studies, and research studies where the concept was used.
4.2. Linking an administrative database to a Statistics Canada survey:
Pros:
- - infuses the administrative claims data with valuable information such as self-rated health, self-reports, diagnostic tools embedded in the survey, contextual information not available in the Repository;
- - assists greatly in validating diagnostic coding through a comparison of self-report and diagnostic codings in the health care system;
- - much less expensive way to follow people longitudinally, and possibly more complete;
- - the percentage of people “agreeing to link” their survey responses in Statistics Canada surveys to provincial health data for purposes of health planning is high. In a recent Manitoba Health /MCHP study, 93% of the people in CCHS agreed to linkage, and the linkage was 95% successful, for an overall “response rate” of 88%, ie, 88% of those originally in the survey also had cross-links to the Repository for longitudinal studies.
Cons:
- - variability by province as to what can be linked, both through the available datasets and through differences in provincial legislation;
- - some of the largest Statistics Canada datasets (NPHS, CCHS) do not survey “on-reserve” First Nations, so the cohort established through a linkage will miss this grouping. This is particularly problematic in northern Manitoba, where regional health authorities have up to 60% or more of their population living in First Nations communities
5. Conclusions
There is a wealth of information collected through administrative claims databases in Canada. These are information-rich environments with which to examine population-based health status and use of services information. Linking cross-sectional Statistics Canada surveys to existing provincial population-based data could greatly reduce the costs of followup, increase the usefulness of both survey and administrative claims data, and make use of one of Canada’s main research resources universal health care system data in creative ways to increase understanding of the health of populations.
References
(note: all MCHP reports are available on the MCHP website, at www.umanitoba.ca/centres/mchp/ and then go to “Reports”)
Brownell M, Lix L, Ekuma O, Derksen S, De Haney S, Bond R, Fransoo R, MacWilliam L, Bodnarchuk J. Why is the health status of some Manitobans not improving? The widening gap in the health status of Manitobans. Winnipeg, MB: Manitoba Centre for Health Policy, March 2003.
Brownell M, Roos N, Fransoo R, Guevremont A, MacWilliam L, Derksen S, Dik N, Bogdanovich B, Sirski M. How do educational outcomes vary with socioeconomic status? Key findings from the Manitoba Child Health Atlas, June 2004.
Carstairs V, Morris R. Deprivation and Health in Scotland. Aberdeen, Scotland: Aberdeen University Press, 1991.
Cleary E. Depression in Manitoba: Patterns of health care use. A comparison of survey and administrative data. University of Manitoba: Winnipeg, MB. Master’s thesis, 2005.
Eyles J, Birch S, Chambers S, Hurley J, Hutchinson B. A needs-based methodology for allocating health care resources in Ontario, Canada: Development and an application. Soc Sci Med 1991;33(4):489-500.
Eyles J, Birch S. A population needs-based approach to health care resource allocation and planning in Ontario: A link between policy goals and practice. Can J Public Health 1993;84(2):112-117.
Frohlich N, De Coster C, Dik N. Estimating personal care home bed requirements. Winnipeg, MB: Manitoba Centre for Health Policy, December 2002.
Martens P, Fransoo R, The Need To Know Team, Burland E, Jebamani L, Burchill C et. al.. The Manitoba RHA Indicators Atlas: Population-based comparisons of health and health care use. Winnipeg, MB: Manitoba Centre for Health Policy, June 2003.
Martens P, Bond R, Lebamani L, Burchill C, Roos N, Derksen S, Beaulieu M, Steinbach C, MacWilliam L, Walld R, Dik N, Sanderson D, Health Information & Research Committee of the Assembly of Manitoba Chiefs, Tanner-Spence M, Leader A, Elias B, O’Neil J. The health and health care use of Registered First Nations people living in Maintoba: A population-based study. Winnipeg, MB: Manitoba Centre for Health Policy, March 2002.
Martens PJ, Sanderson D, Jebamani L. Health services use of Manitoba First Nations people: Is it related to underlying need? Can J Public Health 2005: 96(supplement 1): S39-S44).
Martens P, Fransoo R, McKeen N, The Need to Know Team, Burland E, Jebamani L, Burchill C, De Coster C, Ekuma O, Prior H, Chateau D, Robinson R, Metge C. Patterns of regional mental illness disorder diagnoses and service use in Manitoba: A population-based study. Winnipeg, MB: Manitoba Centre for Health Policy, September 2004.
Martens PJ, Roos NP. When health services researchers and policy-makers interact: Tales from the tectonic plates. Healthcare Policy 2005;1(1):72-84.
Martens PJ, Frohlich N, Brownell M, Carriere K, Derksen S. Embedding child health within framework of regional health: Population health status and sociodemographic indicators. Canadian Journal of Public Health 2002:93(Supplement 2): S15-S20.
Menec V, MacWilliam L, Soodeen R, Mitchell L. The health and health care use of Manitoba’s seniors: Have they changed over time? Winnipeg, MB: Manitoba Centre for Health Policy, September 2002.
Menec V, Lix L, Steinbach C, Ekuma O, Sirski M, Dahl M, Soodeen R. Patterns of health care use and cost at the end of life. Winnipeg, MB: Manitoba Centre for Health Policy, February 2004.
Menec V, Roos N, Nowicki D, MacWilliam L, Finlayson G, Black C. Seasonal patterns of Winnipeg hospital use. Winnipeg, MB: Manitoba Centre for Health Policy and Evaluation, October 1999.
Reid RJ, Roos NP, MacWilliam L, Frohlich N, Black C. Assessing population health care need using a claims-based ACG morbidity measure: A validation analysis in the province of Manitoba. Health Services Research 2002;37(5):1345-1364.
Roos LL, Menec V, Currie RJ. Policy analysis in an information-rich environment. Social Science & Medicine 2004; 58:2231-2241.
Roos N, Shapiro E, Bond R, Black C, Finlayson G, Newburn-Cook C et al. Changes in health and health care use by Manitobans, 1985-1998. Winnipeg, MB: Manitoba Centre for Health Policy, May 2001.
Stewart D, Tate R, Finlayson G, MacWilliam L, Roos N. Projecting hospital bed needs for 2020. Winnipeg, MB: Manitoba Centre for Health Policy, June 2002.
 Click on the PFD icon above to download the entire paper