


Perspectives on Longitudinal Surveys
Randall J. Olsen
Ohio State University
In discussing longitudinal studies, by far the most difficult problem we need to solve is exactly how to pronounce longitudinal. Janet, being a right thinking person and thoroughly American will, I am confident, provide excellent instruction on this point whereupon we can move to less difficult and contentious matters.
The National Longitudinal Surveys started in 1966 with the intention of following the respondents for five years. These respondents were drawn from different birth cohorts, young men, young women, middle-aged women and men nearing retirement, but frequently from the same families. The first four cohorts in Table 1 all started in the mid to late 1960s.
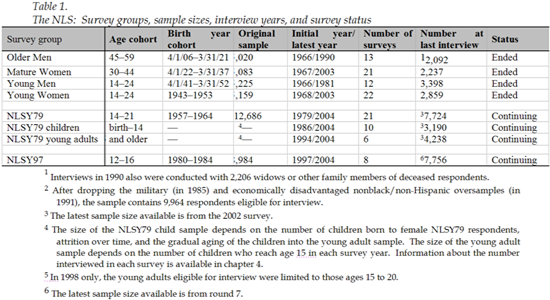
The usefulness of longitudinal data became apparent, leading the Department of Labor to not only continue the effort, but expand it, first in 1979 with the addition of a new youth cohort, in 1986 with the Children of the NLSY and again in 1997 with another new youth cohort. For example, the original cohorts of the NLS were started to help understand why youth unemployment was so high (at least by the standards of the 1950's). What followed was a variety of reports that documented the differences in labor market turnover that foreshadowed labor market success. That is, some youths had careers that churned among low skill jobs with little earnings growth whereas others exhibited trajectories of steadily improving job descriptions and earnings. For the cohort of adult women, the study documented the dynamics of their children growing older and the mothers making a transition back into the labor force. For the older men, the issue was early retirement, and the surveys revealed the interplay of health, income, family composition and wealth in the decision to retire. The early years of the NLS corresponded to a time when racial differences in labor market outcomes attracted both policy and academic interest. Some of the early reports from the NLS focused on how factors such as health, veteran's status, education and training had differential impacts on Blacks and whites and how their work lives changed over time.
By now, the NLS bibliography has over 5000 items and is growing at about 250 items per year. Given this number, speculating on what are the most significant findings will likely offend a lot of people. Instead, let us focus on the data elements that have been more useful to researchers and the design elements that were central to those elements. One of the distinguishing characteristics of the NLS data is its use of event history data.
1. Event Histories
My reading of the history suggests that Burt Singer made a very strong case for the collection of data in event history format for the NLSY79. From the outset, the NLSY79 was designed to have event histories on employment, schooling, training, fertility and marriage. For all but schooling, we used bounded interviewing, that is, reminding the respondent where they stood with respect their employment status, etc. at the previous interview, obtaining either conformation or correction, and proceeding to extend the event history. When the survey was permanently shifted to computer assisted interviewing in 1993, we also collected the program recipiency data in event history form and implemented bounded interviewing for the schooling event history. The NLSY79 followed a complementary field strategy of returning to non-respondents in subsequent years no matter how many rounds they had missed, unless of course they had to be dropped from the study due to hostility . For the original cohorts of the NLS the Census Bureau had a policy of dropping respondents who had not been interviewed for two years an inferior policy that we finally convinced them to change.
Now, returning to respondents to pick up the event history from where ever it was left off required careful design and of the instrument, careful handling of the "information sheet" items that drive the bounded interviewing, and careful handling of the answer file so the public use file released these data in a usable format. Usable and simple to use can be two very different things.
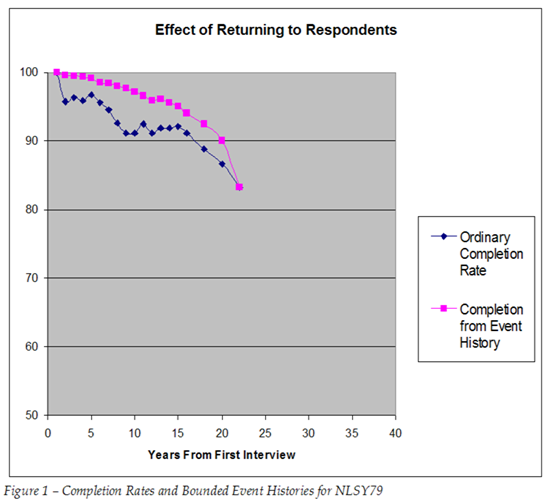
Figure 1 above shows the impact of utilizing an event history in conjunction with returning to past non-respondents. The darker, lower line shows the fraction of in-scope respondents interviewed at various years after the first interview in 1979 often referred to as the completion rate. Interviews were yearly through 1994 and after that only occurred in even-numbered years. The lighter, higher line shows the fraction of the event history data from each year that we ultimately recovered from the respondent. That is, information from the tenth year after the baseline could be recovered either in the tenth round of the survey or in any round after the tenth due to the "since the date of the last interview" design. Looked at in this way, the high response rates obtained by NORC in the NLSY79 are, if anything, misleadingly pessimistic when it comes to the core areas of the survey that we support with event histories.
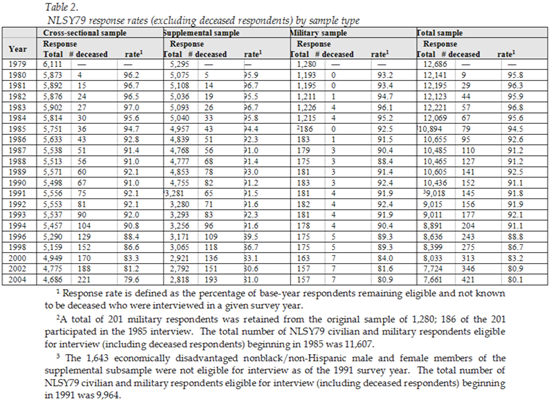
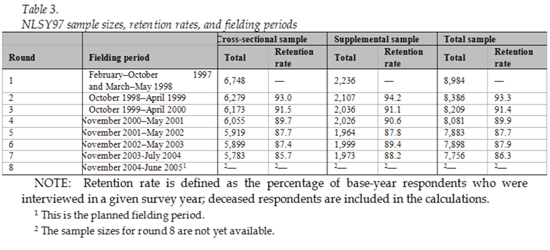
Tables 2 and 3 below provide a more detailed look at completion rates in the NLSY79 and NLSY97 and document how completion rates have fallen even though the broad designs of these two cohorts are very similar.
An important issue in labor economics is the effect of tenure with a firm versus experience, which can be had with any firm, on the rate of pay. This goes to the heart of the concept of human capital, and especially specific human capital, which is skill accrued with an employer that is valued more highly by the incumbent employer than elsewhere in the labor market. Studying the role of specific human capital requires accurate data that identifies for whom each person has worked over their entire working life. When it comes to understanding how the market rewards skills, characteristics and experience, research is indivisible. That is, if one has erred in determining the part of earnings due to specific or general human capital, one is at substantial risk of mis-estimating other important magnitudes, such as the return to education, Black-White earnings gaps, or the union-nonunion wage differential. Earnings from work dominate economic magnitudes and deserve all the study they receive. The NLS data have been especially powerful for studying labor force dynamics in large part because of the scope and completeness of the employment event history, which goes back to basic design decisions.
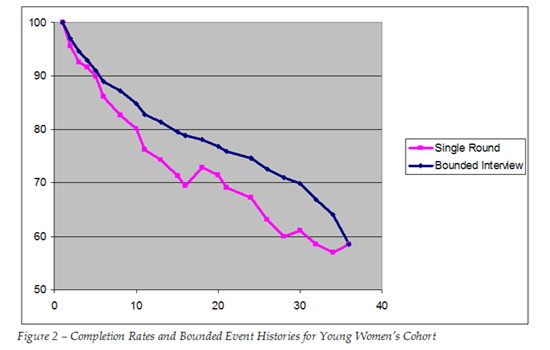
Turning back to the lower line in Figure 1, it may be useful to say a few words about how that line got to be where it is and why it looks different from Figure 2 below, which shows similar information from the Young Women's cohort of the NLS a study began in 1968 when the women were at similar ages as the NLSY79 when it was started. The lower line for the Young Women falls at a faster rate overall even though it also had a high completion rate early on. The Census Bureau collected the data for the Young Women and it has real advantage at "getting the foot in the door" inasmuch as far more people have heard of the Census Bureau and know what it does than is the case for NORC.
First of all, returning to lapsed respondents accounts for much of the difference. Virtually anyone can pick out the year when we persuaded Census to return to past non-respondents, although by then many of the past non-respondents were unlocatable with the passage of time. Second, the length of the field period matters. The Census Bureau has responsibility for so many surveys that each one has a time slot. When it comes to persuading respondents, sometimes it simply takes time. A longer field period albeit at a lower intensity allows a lot of respondents to be converted. Finally, respondent fees. My rule of thumb is that 50-60% of the respondents will do a new wave of a longitudinal survey no matter what. Another 10% will not do that survey wave no matter what. The rest of the respondents are for sale and the price, and unit of payment, is highly variable. Sometimes the price is in small gifts, sometimes bending to idiosyncratic respondent desires about how and when the interview is to be done. Other respondents can be "sold" on the survey by being persuaded that they are part of something larger and more important. After all, often people with Ph.D.s can be recruited to highly prestigious universities or government agencies at a lower price than at organizations with substantially inferior reputations. Why should we suspect respondents are any different? Good respondent materials and a skilled approach to a respondent can cater to an otherwise reluctant person's ego with some success.
However, for some respondents the price is money, but even here the price is not uniform. Luckily for longitudinal surveys, repeated contacts with a respondent frequently gives us information as to what price may be necessary to convert a non-respondent. That is not to say that a non-extortionate fee can convert anyone, but the judicious application of respondent fees can raise response rates from five to ten percentage points. In fact, frequently response fees, judiciously applied, can reduce costs. Ironically, survey programs often spend large amounts of time on callbacks, personal visits, respondent materials and other high-cost ways of converting reluctant respondents but they can be unwilling spend less by offering the money to the respondent instead.
Survey funders or survey staff can find it offensive that respondent fees end up "rewarding" respondents for poor behavior. Sometimes people in the survey business prefer to spend more to get less rather than reward people who are motivated by different things than people whose careers are centered on public service. A commitment to recovering a highly complete event history spans everything from survey design to a tolerance for diversity in what motivates people. A strategy of paying all respondents the same fee will likely make it prohibitively expensive to pay the sorts of fees that will convert reluctant respondents in the longitudinal survey. When our studies employ unequal respondent fees, we pay the same to all persons in a family unit to prevent invidious comparisons. Fees are not only a cost effective tool to encourage survey response, but they can actually reduce the cost of converting difficult respondents. Government agencies are often reluctant to take such measures, but this is a straightforward case of which the sponsor wants more: higher response rates or intact sensitivities.
While we are on the subject of making fielding practices cost-effective, let me make a brief aside on the implications of the wide-open spaces of Canada. For the past four years we have pursed a strategy that enables us to utilize interviewers in remote locations as if the interviewers were in a virtual telephone shop. By giving them a broadband connection, interviewers in Hartland, New Brunswick (home of over 900 people and the world's longest covered bridge) operate as if they were sitting in a brick and mortar call center in Ottawa. We use a combination of Voice over IP and a web-based survey system to replicate all the capabilities of a call center. This approach would allow Statistics Canada to keep remote interviewers busy with conventional telephone work between surveys that require a local presence. If Statistics Canada does not have this capability it ought to consider the potential this approach would have for making its data collection operations more efficient.
2. Child Development
One of the more influential components of the NLS program has assessed the biological children of the female respondents in the 1979 youth cohort as a child development survey. This effort, which started in 1986 and is led by Frank Mott at CHRR, demonstrated the power of longitudinal surveys of children as opposed to efforts that follow pupils in a narrow set of age ranges for just a few years.
A couple of features were central to the success of this study. First, because we followed the mothers since 1979, we had very comprehensive information about the mother and the family unit. This included a comprehensive battery of cognitive tests administered to most respondents in 1980. The mother's behaviors and attributes explain a large fraction of the variation in child development so any study of children that only pays cursory attention to the mother makes a serious error. A study of children that does not collect extensive data on the mother is a mis-allocation of resources. The mother is the 800 pound gorilla of child development.
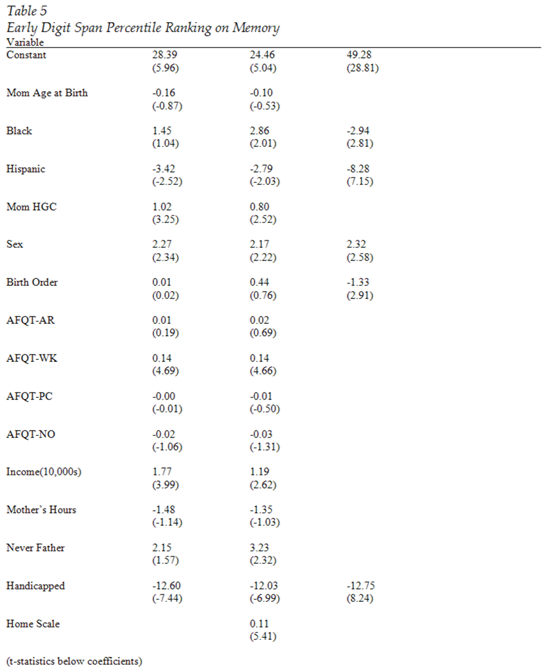
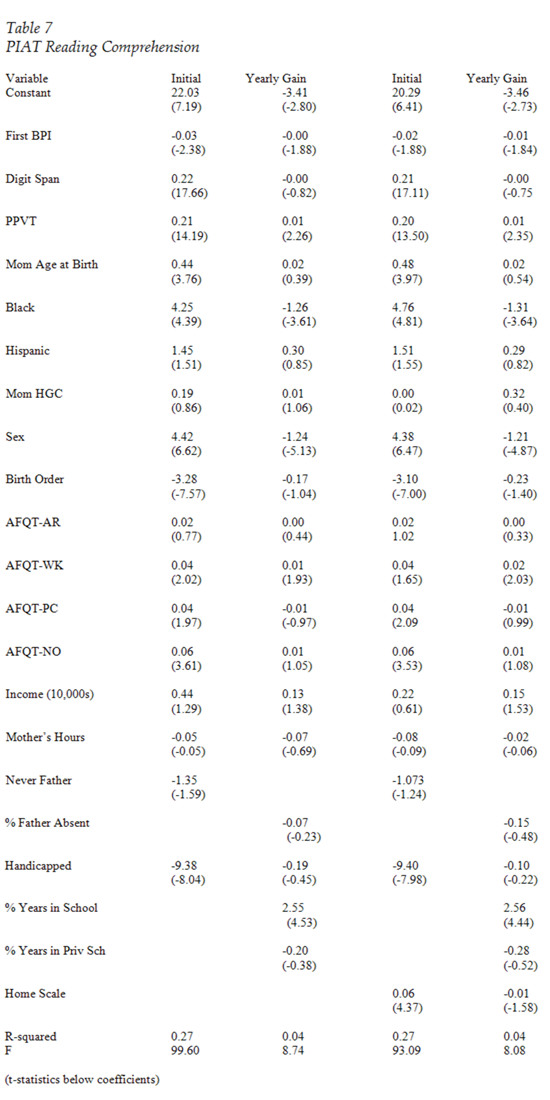
Tables 4-7 below provide a brief illustration of the point. Table 4 gives variable definitions. All regression results use OLS. Table 5 shows the factors explaining variation on the Digit Span Memory test at age 4 a test that is a good "ability" test in that race effects tend to be smaller than for other tests and relies on memory rather than exposure to vocabulary in the home shows maternal characteristics matter a lot. Table 6 provides the determinants of a child's early Peabody Picture Vocabulary Test (PPVT), usually given when the child is about four. The metric for scores is percentage points, from zero to one hundred. For every five percentage points a mother's AFQT word knowledge subscale increases, her child gains about one point on the PPVT. Mother's word knowledge has a slightly smaller, but still significant, effect on Digit Span scores. The mother's education also has a substantial impact. One year of education for the mother and 10 percentile points on her AFQT work knowledge score is worth about $10,000 per year of family income (1999 dollars) in terms of their relative effects on early child outcomes. Table 7 looks at the child's PIAT Reading Comprehension percentile ranking both at the initial test, which is about age 6 (first grade) and also the yearly gain between the first and last test (at about age 14). Unsurprisingly, children who score well as preschoolers on the Digit Span and PPVT score well when they enter school the effects are large and significant. Moreover, the effects of the child's early PPVT score and the mother's word knowledge score are significant factors in moving some children up their peer ranking in reading comprehension. Not only do the advantages at age four lead to a higher ranking in first grade, but the advantage continues to grow through age fourteen. It cannot be too much of a surprise that if the mother matters in early childhood she continues to matter as the child continues on into middle school.
These findings have been echoed over and over as analysts look at the Children of the NLSY. Recently researchers using these data to study child obesity found a similar impact maternal obesity before pregnancy foreshadows obesity for the child. The lesson here appears to be that we should design child studies in a way that collects comprehensive data on the mother so we avoid attributing maternal effects to other variables.
The second important feature of the Children of the NLSY was following all the children of a woman. Once we have data on all a child's siblings it opens up a variety of analytic opportunities. Maternal and family effects are important to social, emotional and cognitive development. Being able to look at siblings and ask which are the factors that differ across siblings and contribute to different outcomes allows us to isolate what is important and what is not. While assessing all the children in a family raises burden, studies of child outcomes have a lot of face validity to respondents and interviewers can make a good case justifying the burden to the family.
It turns out that my wife has been working the other side of this same street for even longer than I have. She has taught kindergarten and first grade for longer than she wants me to say. A staple of our conversations over the years has been a comparison of what she has learned by watching children in the classroom and getting to know their parents versus what the data in the Children of the NLSY have shown. Time and time again, the children in her classrooms conform to the pattern above, although she doesn't test the parents, at least in ways they ever recognize. When quantitative analysis matches up with decades of qualitative assessments we ignore these lessons at our peril. Looking for effects of vouchers, choice, bussing, class size and so forth are good sport. Unfortunately the dirty little secret is that these factors are most likely dwarfed by the mother and the home of course that is precisely the message that, possibly for political reasons, no one wants to deliver.


3. Geographic Data
The NLS program releases its data in two formats a public use version on the Web and a "geocode" version that requires a restrictive agreement with the Bureau of Labor Statistics. The geocode version of the data provides information on the respondent's county. There are over 3,000 counties in the U.S., so while the level of detail is not terribly fine for large metro areas, one certainly has a wealth of contextual data with the inclusion of the county codes. Not surprisingly, almost two hundred users order the geocode data each year. With roughly 900 users who are registered to download data from our Web site, this is a good fraction of users. The lesson here is that researchers value geographic data and it is a real mistake not to make these data available.
In addition to the county level data, we have gone back to the late 1970's to geocode each respondent's address latitude and longitude to a precision that in most cases places the respondent within about 50 feet of their true location. Naturally, these data cannot be made publicly available, but geographic data at this level opens up many opportunities for analysis that we did not think of twenty years ago.
We often think of geographic clustering as a necessary evil in sampling designs. I believe using geocode data in the analysis can change this perspective. First of all, by including some fairly basic variables at the county level, one can significantly attenuate the intracluster correlation that makes the true standard errors in a regression larger than the naively computed standard errors. To first approximation, the "design effect", which measures the necessary adjustment to standard errors for clustered samples, is 1+(k-1)p, where k is the cluster size and p the intra-cluster correlation. Simple demographic measures from the counties that make up the cluster explain a significant fraction of the "shared variance" for a cluster. Second, the behaviors of peer respondents within the same cluster can serve as instruments in more sophisticated analyses. For example, one can use detailed latitude and longitude data to compute the number of employers or child care providers within a predetermined radius, the availability of health care providers and other creative analytic constructs.
To be sure, there are confidentiality problems that arise with geographic data. That said, as institutional review boards become more assertive in how researchers use data, the balance of risk associated with inappropriate data use is shifting from data providers to data users as users, even of secondary data, are being forced to explain to their IRBs what measures they are taking to protect respondent confidentiality as a part of their human subjects protocols. At the risk of irrational optimism, if this shift allows us to release more detailed geographic data to users the research community will be better served despite the aggravations of IRBs. We need to be more creative in appending variables derived from geographic information systems into public use files in a manner that does not compromise confidentiality. This will require thought but will surely pay dividends. For example, we are constructing a matrix of unsigned distances between all our respondents' locations in all survey waves. This will support an examination of migration without referencing exact locations.
Under the heading of what we have learned, the ability of geographic data to enhance our understanding of which factors influence behavior appears to be steadily creeping up the list. Measures that suppress geography increasingly carry a serious loss to the research community, especially compared to the rather speculative disclosure risks. The law is the law, so for Stat Can the challenge is to develop institutions that allow these research benefits within their legal constraints.
4. Missed Opportunities
There are two areas where we missed big opportunities schooling and health, although it is not yet too late for health. With the Child Survey's attention on social, emotional and cognitive development, perhaps the most important part of the process for which data are missing is schooling. It is not for want of trying. We collected data on the schools the children attended covering the years 1993-1995. However, changing standards regarding confidentiality made it impossible to collect detailed data on the children from their teachers, and the data we could release in a public use sample was heavily circumscribed. Given these limitations, we did not press ahead with additional schooling surveys for subsequent years. Comprehensive data on schooling processes and attributes together with detailed data on maternal and household characteristics would, in principle, support a more careful separation of the effects of schools versus the home environment a difficult yet important research topic with significant policy implications.
On the health side, again the growing stringency of confidentiality rules and the justifiable unease, to say nothing of cost, about imbedding a detailed health study within a general purpose social science survey makes it difficult to combine these two strands of research. For the NLS, the sample starts off with many siblings and, in the case of the NLSY79, includes a second generation of respondents who are the children of the female respondents. Kinship networks will add a lot to health analyses by allowing researchers to control for family and hence at least some genetic effects, the opportunity loss of not mounting a serious effort in health becomes larger. Because the NLS is based in the Bureau of Labor Statistics, a combination of health and labor market analyses is a harder sell than, for example, with NIH alone. We all need someone to show the way and demonstrate that obtaining medical measurements from general survey respondents does not poison the well of cooperativeness.
The research gains from extended sib networks testify to another missed opportunity establishing a matrilineal strategy for tracking both individuals and the biological children of the females generation after generation. Every time users confront longitudinal data they almost always want data from earlier in the life cycle. By backward recursion one arrives at the conclusion that we want our samples to begin before the mother's pregnancy and continue for life. Assessing the offspring produced by the females in the Children of the NLSY would provide powerful data. Organizations such as Stat Can are ideally suited to pull off this strategy.
Perhaps the greatest unexploited opportunity for survey projects lies in administrative data. Again, the increased stringency regarding confidentiality and consent make this more difficult than it once was. For agencies such as Stat Can this is not likely as big an obstacle as for those of use less firmly located inside government, but as a way to validate our data and explore the seriousness of non-response bias, administrative data can be a powerful tool. We are in the process of securing permission to match unemployment insurance employment data on earnings and employers from Ohio to our survey data. Being able to match from a wider variety of states would improve matters, but the permission process required makes this difficult. Knowing the measurement error process in our data will only improve analysis.
Finally, I will close with what I consider the largest error we have made. With the advent of computerized interviewing we have the tools to administer surveys that would have been technically infeasible in the days of pencil and paper if only because the sorts of check items we can execute on the computer are far more sophisticated than what interviewers could execute on a paper form. Despite our efforts to generate printed questionnaires that suppress much of the complexity in computerized questionnaires, when we have produced complex sections they have often been a nightmare for users. Our questionnaires have, in places, complex branching and rostering that defies comprehension by users not intimately familiar with the project. We collect data to serve researchers, and if we make the instruments opaque we suppress usage and ill serve the research community. Because of their inherent complexity, longitudinal data have never suffered fools gladly, but the punishment is, at times, extreme.
 Click on the PFD icon above to download the entire paper